Grundlæggende statistik
| Institutionelle ejere | 422 total, 417 long only, 0 short only, 5 long/short - change of -4,23% MRQ |
| Gennemsnitlig porteføljeallokering | 0.3656 % - change of 3,20% MRQ |
| Institutionelle aktier (lange) | 1.538.861.576 (ex 13D/G) - change of -20,41MM shares -1,20% MRQ |
| Institutionel værdi (lang) | $ 3.642.336 USD ($1000) |
Institutionelt ejerskab og aktionærer
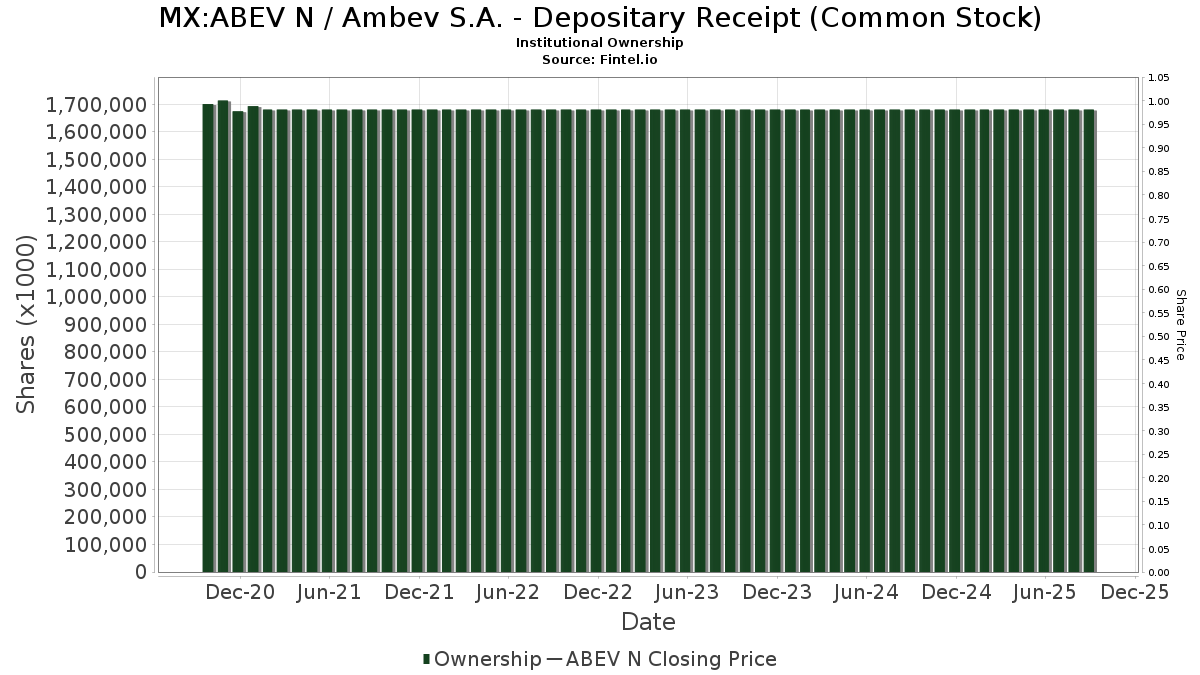
Ambev S.A. - Depositary Receipt (Common Stock) (MX:ABEV N) har 422 institutionelle ejere og aktionærer, der har indsendt 13D/G- eller 13F-formularer til Securities Exchange Commission (SEC). Disse institutioner har i alt 1,538,861,576 aktier. Største aktionærer omfatter First Eagle Investment Management, LLC, GQG Partners LLC, SGENX - First Eagle Global Fund Class A, Westwood Global Investments, LLC, GQGPX - GQG PARTNERS EMERGING MARKETS EQUITY FUND Investor Shares, SGOVX - First Eagle Overseas Fund Class A, Morgan Stanley, Massachusetts Financial Services Co /ma/, Bank Of America Corp /de/, and Seafarer Capital Partners, LLC .
Ambev S.A. - Depositary Receipt (Common Stock) (BMV:ABEV N) institutionel ejerskabsstruktur viser aktuelle positioner i virksomheden efter institutioner og fonde, samt seneste ændringer i positionsstørrelse. Større aktionærer kan omfatte individuelle investorer, investeringsforeninger, hedgefonde eller institutioner. Skema 13D angiver, at investoren besidder (eller besidder) mere end 5 % af virksomheden og har til hensigt (eller har til hensigt at) aktivt at forfølge en ændring i forretningsstrategi. Skema 13G indikerer en passiv investering på over 5%.
Fondens stemningsscore
Fund Sentiment Score (fka Ownership Accumulation Score) finder de aktier, der bliver mest købt af fonde. Det er resultatet af en sofistikeret, multi-faktor kvantitativ model, der identificerer virksomheder med de højeste niveauer af institutionel akkumulering. Scoringsmodellen bruger en kombination af den samlede stigning i oplyste ejere, ændringerne i porteføljeallokeringer i disse ejere og andre målinger. Tallet går fra 0 til 100, hvor højere tal indikerer et højere niveau af akkumulering for sine jævnaldrende, og 50 er gennemsnittet.
Opdateringsfrekvens: Dagligt
Se Ownership Explorer, som giver en liste over højest rangerende virksomheder.
AI+ Ask Fintel’s AI assistant about Ambev S.A. - Depositary Receipt (Common Stock).
Select a question to share a public post with an AI-crafted answer.
Thinking of good questions…
13F og NPORT arkivering
Detaljer om 13F-arkivering er gratis. Detaljer om NP-ansøgninger kræver et premium-medlemskab. Grønne rækker angiver nye positioner. Røde rækker angiver lukkede positioner. Klik på linket ikon for at se den fulde transaktionshistorik.
Opgrader
for at låse premium-data op og eksportere til Excel ![]() .
.
| Fil dato | Kilde | Investor | Type | Gennemsnitlig pris (Øst) |
Aktier | Δ Aktier (%) |
Rapporteret Værdi ($1000) |
Δ Værdi (%) |
Port Alloc (%) |
|
|---|---|---|---|---|---|---|---|---|---|---|
| 2026-01-29 | 13F | Aprio Wealth Management, LLC | 0 | -100,00 | 0 | |||||
| 2026-02-17 | 13F | Russell Investments Group, Ltd. | 4.163.488 | -60,32 | 10.284 | -56,05 | ||||
| 2026-02-02 | 13F | Miracle Mile Advisors, LLC | 15.581 | 38 | ||||||
| 2026-02-05 | 13F | Cambridge Investment Research Advisors, Inc. | 753.507 | 2,14 | 2 | 0,00 | ||||
| 2026-02-17 | 13F | Wellington Management Group Llp | 820.144 | -3,81 | 2.026 | 6,52 | ||||
| 2026-02-03 | 13F | We Are One Seven, LLC | 16.695 | -1,06 | 41 | 10,81 | ||||
| 2026-02-13 | 13F | Umb Bank N A/mo | 14.847 | 197,12 | 37 | 227,27 | ||||
| 2026-02-17 | 13F | Talaria Asset Management Pty Ltd | 0 | -100,00 | 0 | |||||
| 2026-02-05 | 13F | Bank Julius Baer & Co. Ltd, Zurich | 38.489 | 0,00 | 95 | 11,76 | ||||
| 2026-02-03 | 13F | Virtus Family Office LLC | 799.182 | 4,69 | 2.041 | 18,81 | ||||
| 2025-09-26 | NP | SGENX - First Eagle Global Fund Class A | 166.791.911 | 0,00 | 363.606 | -13,83 | ||||
| 2026-02-02 | 13F | Advisors Preferred, LLC | 0 | -100,00 | 0 | |||||
| 2025-09-25 | NP | DFAX - Dimensional World ex U.S. Core Equity 2 ETF | 171.606 | 16,18 | 374 | 0,27 | ||||
| 2026-02-18 | 13F | EP Wealth Advisors, Inc. | 76.828 | 51,46 | 190 | 54,92 | ||||
| 2026-02-13 | 13F | First Trust Advisors Lp | 10.484 | -4,65 | 26 | 4,17 | ||||
| 2026-01-23 | 13F | Freestone Capital Holdings, LLC | 34.777 | -26,15 | 86 | -19,05 | ||||
| 2026-01-23 | 13F | Sumitomo Mitsui Trust Holdings, Inc. | 151.500 | -71,76 | 374 | -68,73 | ||||
| 2026-02-17 | 13F | Aqr Capital Management Llc | 238.688 | 33,74 | 590 | 48,36 | ||||
| 2026-02-24 | 13F | MidFirst Bank | 375 | 1 | ||||||
| 2026-01-27 | 13F | TD Waterhouse Canada Inc. | 89.250 | 0,00 | 220 | 11,17 | ||||
| 2026-02-03 | 13F | Manning & Napier Advisors Llc | 1.154.607 | -2,15 | 2.863 | 5,96 | ||||
| 2026-02-17 | 13F | Bulltick Wealth Management, LLC | 48.407 | 15,27 | 124 | 30,85 | ||||
| 2026-01-23 | 13F | BSW Wealth Partners | 36.248 | -23,71 | 90 | -15,24 | ||||
| 2026-02-03 | 13F | Ethic Inc. | 722.583 | 4,68 | 1.785 | 15,92 | ||||
| 2026-02-11 | 13F | Brandes Investment Partners, Lp | 22.600.124 | 4,03 | 55.822 | 15,22 | ||||
| 2026-02-12 | 13F | BRYN MAWR TRUST Co | 0 | -100,00 | 0 | -100,00 | ||||
| 2026-02-12 | 13F | DRW Securities, LLC | 68.607 | 169 | ||||||
| 2026-02-11 | 13F | Cerity Partners LLC | 169.328 | -15,03 | 418 | -5,86 | ||||
| 2026-01-22 | 13F | Financial Consulate, Inc | 216 | 1 | ||||||
| 2026-02-17 | 13F | Ancora Advisors, LLC | 212 | 1 | ||||||
| 2026-02-03 | 13F | Sageworth Trust Co | 0 | -100,00 | 0 | |||||
| 2026-01-05 | 13F | Rosenberg Matthew Hamilton | 4.442 | 0,00 | 11 | 11,11 | ||||
| 2026-02-13 | 13F | Itau Unibanco Holding S.A. | 0 | -100,00 | 0 | |||||
| 2026-01-12 | 13F | CVA Family Office, LLC | 80.000 | 0,00 | 198 | 10,67 | ||||
| 2026-02-10 | 13F | Axq Capital, Lp | 17.917 | 44 | ||||||
| 2026-02-06 | 13F | Vestmark Advisory Solutions, Inc. | 15.263 | 4,18 | 38 | 15,63 | ||||
| 2026-02-17 | 13F | Citadel Advisors Llc | Call | 61.700 | -48,41 | 152 | -42,86 | |||
| 2026-02-18 | 13F | Mackenzie Financial Corp | 0 | -100,00 | 0 | |||||
| 2026-02-17 | 13F | Citadel Advisors Llc | 3.628.812 | 10.654,27 | 8.963 | 11.850,67 | ||||
| 2026-02-06 | 13F | Motco | 242.359 | -6,18 | 599 | 3,82 | ||||
| 2026-02-17 | 13F | Citadel Advisors Llc | Put | 39.400 | -2,23 | 97 | 8,99 | |||
| 2026-02-11 | 13F | Simplex Trading, Llc | 0 | -100,00 | 0 | |||||
| 2026-02-19 | 13F | CI Private Wealth, LLC | 2.850.615 | 0,89 | 7.039 | 11,73 | ||||
| 2025-08-29 | NP | LIVR - Intelligent Livermore ETF | 65.040 | 157 | ||||||
| 2026-01-23 | 13F | Robeco Institutional Asset Management B.V. | 0 | -100,00 | 0 | |||||
| 2026-02-12 | 13F | Hrt Financial Lp | 15.530 | 0 | ||||||
| 2026-02-02 | 13F | Balentine LLC | 0 | -100,00 | 0 | |||||
| 2025-10-22 | 13F | Kercheville Advisors, LLC | 0 | -100,00 | 0 | |||||
| 2025-08-28 | NP | GQGPX - GQG PARTNERS EMERGING MARKETS EQUITY FUND Investor Shares | 86.666.901 | -15,40 | 208.867 | 10,21 | ||||
| 2026-01-29 | 13F | Sanctuary Advisors, LLC | 93.706 | 18,55 | 231 | 31,25 | ||||
| 2026-02-11 | 13F | Parallel Advisors, LLC | 47.082 | 22,48 | 116 | 36,47 | ||||
| 2026-01-15 | 13F | Alhambra Investment Partners LLC | 75.239 | 15,40 | 186 | 27,59 | ||||
| 2026-02-13 | 13F | Stifel Financial Corp | 1.168.793 | 3,35 | 2.887 | 14,48 | ||||
| 2026-01-12 | 13F | Salem Investment Counselors Inc | 0 | -100,00 | 0 | |||||
| 2026-02-09 | 13F | Mondrian Investment Partners LTD | 35.386 | 27,50 | 87 | 42,62 | ||||
| 2026-02-11 | 13F | FLC Capital Advisors | 60.465 | 0,00 | 149 | 11,19 | ||||
| 2026-02-13 | 13F | Pathstone Holdings, LLC | 73.098 | 88,41 | 181 | 109,30 | ||||
| 2026-01-28 | 13F | B. Metzler seel. Sohn & Co. AG | 2.128.785 | 187,71 | 5.263 | 219,10 | ||||
| 2026-02-17 | 13F | Two Sigma Advisers, Lp | 1.101.000 | -72,67 | 2.719 | -69,73 | ||||
| 2026-02-20 | 13F | Ruggaard & Associates LLC | 10.000 | 0,00 | 25 | 9,09 | ||||
| 2026-01-20 | 13F | Perpetual Ltd | 168.569 | 0,00 | 416 | 10,93 | ||||
| 2026-02-17 | 13F | United Capital Financial Advisers, Llc | 17.245 | 24,68 | 43 | 40,00 | ||||
| 2026-02-12 | 13F | Banco BTG Pactual S.A. | 20.400 | -80,63 | 50 | -78,63 | ||||
| 2026-02-13 | 13F | Schroder Investment Management Group | 2.518.479 | -48,59 | 6.246 | -44,33 | ||||
| 2026-02-12 | 13F | Xponance, Inc. | 19.777 | 9,17 | 49 | 20,00 | ||||
| 2026-02-13 | 13F | Focused Alpha, Llc | 80.117 | 198 | ||||||
| 2026-02-05 | 13F | Atria Investments Llc | 192.874 | 45,29 | 476 | 60,81 | ||||
| 2026-02-17 | 13F | Bank Of America Corp /de/ | 33.619.069 | 27,55 | 83.039 | 41,28 | ||||
| 2026-01-30 | 13F | Caldwell Securities, Inc | 111 | 0,00 | 0 | |||||
| 2026-02-11 | 13F | Simplex Trading, Llc | Put | 423.800 | 0,17 | 1.047 | ||||
| 2026-02-11 | 13F | Simplex Trading, Llc | Call | 105.900 | 78,58 | 262 | ||||
| 2026-01-28 | 13F | CAPROCK Group, Inc. | 116.651 | 44,66 | 298 | 62,30 | ||||
| 2026-02-17 | 13F | Jones Financial Companies Lllp | 123.359 | 10,14 | 305 | 18,29 | ||||
| 2025-09-26 | NP | INVESCO ACTIVELY MANAGED EXCHANGE-TRADED FUND TRUST - Invesco Global Equity Net Zero ETF | 35.572 | 78 | ||||||
| 2026-02-12 | 13F | Qtron Investments LLC | 0 | -100,00 | 0 | |||||
| 2026-01-27 | 13F | Checchi Capital Advisers, LLC | 40.494 | 8,20 | 100 | 20,48 | ||||
| 2025-11-13 | 13F | Blueshift Asset Management, LLC | 0 | -100,00 | 0 | |||||
| 2026-01-09 | 13F | 180 Wealth Advisors, Llc | 31.987 | -23,65 | 79 | -15,05 | ||||
| 2026-01-30 | 13F | Renasant Bank | 24.641 | 12,81 | 61 | 25,00 | ||||
| 2026-02-11 | 13F | LPL Financial LLC | 1.392.044 | 13,38 | 3.438 | 25,61 | ||||
| 2026-02-13 | 13F | Ieq Capital, Llc | 49.718 | -67,11 | 123 | -63,80 | ||||
| 2026-02-02 | 13F | Oppenheimer Asset Management Inc. | 227.212 | -1,45 | 561 | 9,14 | ||||
| 2026-02-09 | 13F | Royal Palms Capital LLC | 11.726 | 29 | ||||||
| 2026-02-17 | 13F | IHT Wealth Management, LLC | 10.921 | 27 | ||||||
| 2026-01-30 | 13F | North Star Investment Management Corp. | 3.800 | 0,00 | 9 | 12,50 | ||||
| 2026-02-11 | 13F | O'shaughnessy Asset Management, Llc | 410.722 | -15,99 | 1.014 | -6,97 | ||||
| 2025-09-26 | NP | RETSX - Tax-Managed U.S. Large Cap Fund Class S | 4.104.821 | -45,48 | 8.949 | -53,03 | ||||
| 2026-02-17 | 13F | Regal Investment Advisors LLC | 11.148 | 0,95 | 28 | 12,50 | ||||
| 2026-01-26 | 13F | Riverview Trust Co | 0 | -100,00 | 0 | |||||
| 2026-02-05 | 13F | May Hill Capital, LLC | 15.360 | 38 | ||||||
| 2026-02-17 | 13F | Clear Street Markets Llc | 12.500 | 31 | ||||||
| 2026-02-12 | 13F | Intesa Sanpaolo Wealth Management | 30.000 | 74 | ||||||
| 2026-02-17 | 13F | Aquatic Capital Management LLC | 175.111 | -85,54 | 433 | -84,00 | ||||
| 2026-02-13 | 13F | State Street Corp | 9.058.185 | -29,10 | 23.123 | -19,64 | ||||
| 2026-02-13 | 13F | American Century Companies Inc | 3.831.836 | 12,68 | 9.465 | 24,81 | ||||
| 2026-02-13 | 13F | NLB Skladi, upravljanje premozenja, d.o.o. | 120.000 | 296 | ||||||
| 2026-02-13 | 13F | Wells Fargo & Company/mn | 5.104.722 | 9,35 | 12.609 | 21,11 | ||||
| 2026-02-13 | 13F | Mariner, LLC | 112.053 | 43,36 | 277 | 58,62 | ||||
| 2025-09-26 | NP | FEBAX - First Eagle Global Income Builder Fund Class A | 9.345.635 | 0,00 | 20.373 | -13,83 | ||||
| 2026-02-04 | 13F | First Eagle Investment Management, LLC | 336.057.984 | -0,75 | 830.063 | 9,93 | ||||
| 2026-02-17 | 13F | Northern Trust Corp | 4.769.094 | 25,16 | 11.780 | 38,63 | ||||
| 2026-02-17 | 13F | Private Advisor Group, LLC | 17.674 | -42,45 | 44 | -36,76 | ||||
| 2025-11-13 | 13F | Hsbc Holdings Plc | 2.314.103 | 9,34 | 5.160 | 1,12 | ||||
| 2025-11-06 | 13F | Whipplewood Advisors, LLC | 0 | -100,00 | 0 | |||||
| 2026-01-20 | 13F | Monticello Wealth Management, Llc | 108.856 | 0,00 | 269 | 10,74 | ||||
| 2026-01-27 | 13F | Belpointe Asset Management LLC | 58.193 | 144 | ||||||
| 2026-02-12 | 13F | Fortress Private Ledger, Llc | 177.055 | 48,47 | 437 | 64,91 | ||||
| 2026-02-13 | 13F | Fairman Group, LLC | 117 | -50,00 | 0 | |||||
| 2026-02-13 | 13F | Squarepoint Ops LLC | 295.077 | 52,56 | 729 | 68,91 | ||||
| 2026-01-15 | 13F | Highline Wealth Partners Llc | 2.058 | 0,00 | 5 | 25,00 | ||||
| 2026-02-13 | 13F | Portfolio Resources Advisor Group, Inc. | 15.447 | 39 | ||||||
| 2026-01-28 | 13F | Mountain Capital Investment Advisors, Inc | 11.087 | 0,00 | 31 | 25,00 | ||||
| 2025-09-18 | NP | SFGIX - Seafarer Overseas Growth and Income Fund Investor | 28.000.000 | 0,00 | 61.040 | -13,83 | ||||
| 2026-02-12 | 13F | BlackRock, Inc. | 24.396.861 | 15,75 | 60.260 | 28,20 | ||||
| 2026-02-13 | 13F | Great West Life Assurance Co /can/ | 7.830.792 | 17,31 | 20 | 26,67 | ||||
| 2026-02-17 | 13F | Delaware Management Holdings, Inc. | 25.690.446 | 63.454 | ||||||
| 2025-09-18 | NP | SFVLX - Seafarer Overseas Value Fund Investor Class | 1.069.000 | 0,00 | 2.330 | -13,83 | ||||
| 2026-02-05 | 13F | Roberts Glore & Co Inc /il/ | 31.580 | 0,00 | 78 | 11,43 | ||||
| 2026-02-11 | 13F | Viewpoint Capital Management LLC | 16.300 | 0,00 | 40 | 11,11 | ||||
| 2026-02-13 | 13F | TFB Advisors LLC | 11.699 | 7,87 | 29 | 21,74 | ||||
| 2026-02-17 | 13F | Royal Bank Of Canada | 3.133.086 | 16,30 | 7.739 | 28,83 | ||||
| 2026-02-09 | 13F | Huntington National Bank | 1 | 0,00 | 0 | |||||
| 2025-08-28 | NP | TMLCX - Simt Tax-managed Large Cap Fund Class F | 81.301 | -87,51 | 196 | -83,80 | ||||
| 2025-11-14 | 13F | Lazard Asset Management Llc | 0 | -100,00 | 0 | |||||
| 2026-02-17 | 13F | Raymond James Financial Inc | 2.078.749 | 18,14 | 5.135 | 30,87 | ||||
| 2026-01-29 | 13F | Nbc Securities, Inc. | 213.096 | 0,00 | 526 | 10,74 | ||||
| 2026-01-21 | 13F/A | Winthrop Advisory Group LLC | 24.634 | 0,00 | 63 | 12,73 | ||||
| 2026-02-06 | 13F | Envestnet Portfolio Solutions, Inc. | 49.454 | 2,50 | 122 | 14,02 | ||||
| 2025-11-10 | 13F | Tableaux Llc | 0 | -100,00 | 0 | |||||
| 2026-02-02 | 13F | Montag A & Associates Inc | 4.808 | 0,00 | 12 | 20,00 | ||||
| 2026-02-13 | 13F | Citigroup Inc | 311.733 | 33,43 | 770 | 47,88 | ||||
| 2026-02-17 | 13F | LaSalle St. Investment Advisors, LLC | 55.146 | 0,52 | 0 | |||||
| 2026-02-13 | 13F | Boston Partners | 743.633 | -1,99 | 1.837 | 8,57 | ||||
| 2026-01-22 | 13F | Pinnacle Bancorp, Inc. | 7.028 | 0,00 | 17 | 13,33 | ||||
| 2025-11-04 | 13F | Simmons Bank | 0 | -100,00 | 0 | |||||
| 2026-02-11 | 13F | Group One Trading, L.p. | Call | 0 | -100,00 | 0 | -100,00 | |||
| 2026-01-23 | 13F | Assetmark, Inc | 540.269 | 69,46 | 1.334 | 87,89 | ||||
| 2026-02-13 | 13F | JustInvest LLC | 94.163 | 25,22 | 233 | 38,92 | ||||
| 2026-02-13 | 13F | Kiltearn Partners LLP | 9.445.900 | -14,48 | 23.331 | -5,28 | ||||
| 2025-08-28 | NP | FEOVX - First Eagle Overseas Variable Fund | 1.343.830 | -1,87 | 3.239 | 1,50 | ||||
| 2026-02-12 | 13F | Provida Pension Fund Administrator | 0 | -100,00 | 0 | |||||
| 2026-02-24 | 13F | DGS Capital Management, LLC | 107.834 | 8,38 | 266 | 20,36 | ||||
| 2025-11-14 | 13F | Credit Agricole S A | 0 | -100,00 | 0 | |||||
| 2026-01-06 | 13F | Investors Research Corp | 220.775 | 0,00 | 545 | 10,77 | ||||
| 2026-02-17 | 13F | Warren Averett Asset Management, LLC | 345.429 | 0,93 | 853 | 11,80 | ||||
| 2025-09-23 | NP | VVIFX - Voya VACS Series EME Fund | 378.783 | -16,49 | 826 | -28,07 | ||||
| 2026-02-13 | 13F | Van Eck Associates Corp | 1.564.965 | 9,18 | 4 | 0,00 | ||||
| 2026-02-13 | 13F | Mlp3, Llc | 25.950 | 64 | ||||||
| 2026-02-17 | 13F | Scarborough Advisors, LLC | 553 | 0,00 | 1 | 0,00 | ||||
| 2025-11-14 | 13F | Axa S.a. | 0 | -100,00 | 0 | |||||
| 2026-01-30 | 13F | ARGA Investment Management, LP | 597.022 | -46,21 | 1.475 | -40,44 | ||||
| 2026-02-17 | 13F | Ameriprise Financial Inc | 14.967 | 7,06 | 37 | 19,35 | ||||
| 2026-01-05 | 13F | GAMMA Investing LLC | 8.892 | 63,94 | 22 | 75,00 | ||||
| 2026-02-04 | 13F | Oxbow Advisors, LLC | 0 | -100,00 | 0 | |||||
| 2025-09-25 | NP | DFSE - Dimensional Emerging Markets Sustainability Core 1 ETF | 69.073 | 0,00 | 151 | -13,79 | ||||
| 2026-02-10 | 13F | State of Wyoming | 58.650 | 145 | ||||||
| 2025-11-13 | 13F | Marshall Wace, Llp | 0 | -100,00 | 0 | |||||
| 2026-02-06 | 13F | New Millennium Group LLC | 0 | -100,00 | 0 | |||||
| 2026-02-11 | 13F | SmartHarvest Portfolios, LLC | 24.922 | 62 | ||||||
| 2025-11-14 | 13F | Jain Global LLC | 0 | -100,00 | 0 | |||||
| 2026-02-13 | 13F | Macquarie Group Ltd | 0 | -100,00 | 0 | |||||
| 2026-01-07 | 13F | Riversedge Advisors, Llc | 17.253 | -3,04 | 43 | 7,69 | ||||
| 2026-02-19 | 13F | Atomi Financial Group, Inc. | 144.236 | -1,14 | 356 | 9,54 | ||||
| 2026-02-17 | 13F | Advisory Services Network, LLC | 0 | -100,00 | 0 | |||||
| 2026-02-13 | 13F | Centiva Capital, LP | 11.270 | -96,34 | 28 | -96,07 | ||||
| 2026-02-17 | 13F | Farringdon Capital, Ltd. | 0 | -100,00 | 0 | |||||
| 2026-01-29 | 13F | Vanguard Group Inc | 4.591.730 | -1,01 | 11.342 | 9,65 | ||||
| 2026-02-09 | 13F | Coldstream Capital Management Inc | 27.957 | -56,56 | 69 | -51,75 | ||||
| 2026-02-06 | 13F | EverSource Wealth Advisors, LLC | 16.905 | 18,89 | 42 | 32,26 | ||||
| 2026-02-13 | 13F | Absolute Gestao de Investimentos Ltda. | 141.469 | 349 | ||||||
| 2026-02-17 | 13F | BTG Pactual Asset Management US LLC | 80.352 | -32,18 | 202 | -29,47 | ||||
| 2026-01-27 | 13F | Leisure Capital Management | 18.097 | 45 | ||||||
| 2026-02-10 | 13F/A | Northwestern Mutual Wealth Management Co | 84.194 | -3,22 | 208 | 7,25 | ||||
| 2026-02-17 | 13F | Blair William & Co/il | 136.150 | -3,15 | 336 | 7,35 | ||||
| 2026-01-21 | 13F | Baker Ellis Asset Management LLC | 30.000 | -14,29 | 74 | -5,13 | ||||
| 2026-02-09 | 13F | Hantz Financial Services, Inc. | 797.082 | -4,68 | 2 | 0,00 | ||||
| 2026-02-09 | 13F | Kestra Investment Management, LLC | 13.791 | 10,56 | 34 | 25,93 | ||||
| 2026-02-11 | 13F | Symphony Financial, Ltd. Co. | 0 | -100,00 | 0 | |||||
| 2026-02-12 | 13F | Scotia Capital Inc. | 203.568 | -24,88 | 503 | -16,89 | ||||
| 2026-02-13 | 13F | Strategic Global Advisors, LLC | 0 | -100,00 | 0 | |||||
| 2026-02-13 | 13F | Caitong International Asset Management Co., Ltd | 3 | -99,96 | 0 | -100,00 | ||||
| 2026-01-27 | 13F | Jeppson Wealth Management, Llc | 78.155 | 3,92 | 193 | 15,57 | ||||
| 2026-01-27 | 13F | Forum Financial Management, LP | 11.000 | 0,00 | 27 | 12,50 | ||||
| 2026-02-12 | 13F | Principal Securities, Inc. | 19.593 | 46,38 | 48 | 65,52 | ||||
| 2026-02-05 | 13F | Burford Brothers, Inc. | 568.551 | 5,46 | 1.404 | 16,81 | ||||
| 2026-01-07 | 13F | Hilltop National Bank | 7.850 | 0,00 | 19 | 11,76 | ||||
| 2026-02-02 | 13F | Horizon Investments, LLC | 0 | -100,00 | 0 | |||||
| 2026-02-12 | 13F | Renaissance Technologies Llc | 25.679.400 | -38,35 | 63.428 | -31,71 | ||||
| 2026-02-17 | 13F | Cook & Bynum Capital Management, LLC | 1.354.009 | 0,00 | 3.344 | 10,77 | ||||
| 2026-02-13 | 13F | VPR Management LLC | 387.929 | 0,00 | 958 | 10,75 | ||||
| 2026-01-26 | 13F | Private Trust Co Na | 973 | 2 | ||||||
| 2026-02-11 | 13F | Erste Asset Management GmbH | 250.000 | 605 | ||||||
| 2026-02-11 | 13F | Longfellow Investment Management Co Llc | 1.142.729 | -13,28 | 2.823 | -3,95 | ||||
| 2026-02-14 | 13F | Frec Markets, Inc. | 20.365 | 50 | ||||||
| 2025-09-29 | NP | ECOW - Pacer Emerging Markets Cash Cows 100 ETF | 0 | -100,00 | 0 | -100,00 | ||||
| 2026-02-10 | 13F | Natixis Advisors, L.p. | 196.043 | -78,66 | 0 | -100,00 | ||||
| 2025-09-23 | NP | IEMGX - Voya Multi-Manager Emerging Markets Equity Fund Class I | 213.200 | 0,00 | 465 | -13,91 | ||||
| 2026-02-12 | 13F | Wealthspire Advisors, LLC | 34.067 | 84 | ||||||
| 2026-02-13 | 13F | Rhumbline Advisers | 323.577 | -0,88 | 799 | 9,90 | ||||
| 2025-09-25 | NP | DFA INVESTMENT DIMENSIONS GROUP INC - Emerging Markets Sustainability Core 1 Portfolio Institutional Class This fund is a listed as child fund of Dimensional Fund Advisors Lp and if that institution has disclosed ownership in this security, then these positions will not be double counted when calculating total shares and total value | 220.998 | 0,00 | 482 | -13,95 | ||||
| 2025-11-14 | 13F | AXA Investment Managers S.A. | 29.801 | 66 | ||||||
| 2026-02-17 | 13F | FIL Ltd | 2.000.000 | -33,33 | 4.940 | -26,16 | ||||
| 2026-02-12 | 13F | Earnest Partners Llc | 636.833 | -3,71 | 1.573 | 6,65 | ||||
| 2026-02-24 | 13F | Bell Investment Advisors, Inc | 513 | 0,00 | 1 | 0,00 | ||||
| 2025-11-13 | 13F | Quadrature Capital Ltd | 0 | -100,00 | 0 | |||||
| 2026-01-29 | 13F | Sava Infond d.o.o. | 290.000 | 0,00 | 716 | 10,84 | ||||
| 2026-02-05 | 13F | AustralianSuper Pty Ltd | 411.744 | 1.017 | ||||||
| 2026-01-23 | 13F | Farther Finance Advisors, LLC | 7.615 | 10,25 | 19 | 20,00 | ||||
| 2026-02-03 | 13F | Sequoia Financial Advisors, LLC | 127.485 | -11,81 | 315 | -2,48 | ||||
| 2025-09-25 | NP | Dfa Investment Trust Co - The Emerging Markets Series This fund is a listed as child fund of Dimensional Fund Advisors Lp and if that institution has disclosed ownership in this security, then these positions will not be double counted when calculating total shares and total value | 1.643.290 | 0,00 | 3.582 | -13,83 | ||||
| 2026-02-02 | 13F | Mutual Advisors, LLC | 20.220 | -0,18 | 50 | 11,36 | ||||
| 2026-02-12 | 13F | Insigneo Advisory Services, Llc | 81.645 | -3,39 | 202 | 6,91 | ||||
| 2025-09-18 | NP | ABLG - TrimTabs All Cap International Free-Cash-Flow ETF | 261.265 | 570 | ||||||
| 2026-02-12 | 13F | Barings Llc | 621.824 | 0,00 | 1.536 | 10,75 | ||||
| 2026-02-13 | 13F | Colony Group, LLC | 32.250 | 19,61 | 80 | 29,51 | ||||
| 2026-01-15 | 13F | Frank, Rimerman Advisors LLC | 129.842 | 321 | ||||||
| 2026-02-04 | 13F | Paradigm Asset Management Co Llc | 17.935 | 0,00 | 44 | 12,82 | ||||
| 2025-09-25 | NP | EMGAX - Wells Fargo Emerging Markets Equity Fund Class A | 6.921.112 | -8,00 | 15.088 | -20,72 | ||||
| 2026-01-22 | 13F/A | Cresset Asset Management, LLC | 0 | -100,00 | 0 | |||||
| 2025-09-25 | NP | VMNVX - Vanguard Global Minimum Volatility Fund Admiral Shares | 0 | -100,00 | 0 | -100,00 | ||||
| 2026-01-13 | 13F | Sendero Wealth Management, LLC | 21.540 | 0,00 | 53 | 10,42 | ||||
| 2026-01-30 | 13F | Us Bancorp \de\ | 101.143 | -5,55 | 250 | 4,62 | ||||
| 2026-02-11 | 13F | West Family Investments, Inc. | 51.819 | 0,00 | 128 | 10,43 | ||||
| 2026-01-20 | 13F | Signaturefd, Llc | 11.954 | -41,12 | 30 | -35,56 | ||||
| 2026-01-08 | 13F | Tuttle Tactical Management LLC | 96.899 | 239 | ||||||
| 2026-02-05 | 13F | Stephens Inc /ar/ | 238.790 | 0,54 | 590 | 11,34 | ||||
| 2026-02-17 | 13F | D. E. Shaw & Co., Inc. | 4.933.019 | 90,40 | 12.185 | 110,91 | ||||
| 2025-11-13 | 13F/A | Ninety One UK Ltd | 1.417.785 | -49,35 | 3.162 | -53,14 | ||||
| 2025-11-20 | 13F | First Affirmative Financial Network | 96.342 | 20,94 | 215 | 12,04 | ||||
| 2025-09-25 | NP | DAADX - Emerging Markets ex China Core Equity Portfolio Institutional Class | 112.647 | 0,00 | 246 | -13,73 | ||||
| 2026-02-06 | 13F | Pnc Financial Services Group, Inc. | 58.453 | -27,46 | 144 | -19,55 | ||||
| 2026-02-10 | 13F | Daiwa Securities Group Inc. | 186.000 | 0 | ||||||
| 2026-02-04 | 13F | Bensler, LLC | 11.969 | 0,00 | 30 | 11,54 | ||||
| 2026-02-11 | 13F | Private Management Group Inc | 15.112.841 | -1,21 | 37.329 | 9,42 | ||||
| 2026-02-17 | 13F | Fmr Llc | 484.026 | -1,41 | 1.196 | 9,23 | ||||
| 2026-02-17 | 13F | Cape Investment Advisory, Inc. | 7.052 | 25,41 | 17 | 41,67 | ||||
| 2025-09-25 | NP | VT - Vanguard Total World Stock Index Fund ETF Shares | 532.359 | 0,00 | 1.161 | -13,82 | ||||
| 2026-02-13 | 13F | National Bank Of Canada /fi/ | 196.185 | 21,17 | 483 | 34,26 | ||||
| 2025-11-14 | 13F | Two Sigma Securities, Llc | 0 | -100,00 | 0 | |||||
| 2026-01-12 | 13F | Abound Wealth Management | 78 | 0,00 | 0 | |||||
| 2026-02-18 | 13F | Onyx Bridge Wealth Group LLC | 37.368 | 0,00 | 92 | 10,84 | ||||
| 2026-02-10 | 13F | SCS Capital Management LLC | 440.909 | 0,52 | 1.089 | 11,35 | ||||
| 2026-02-02 | 13F | Strs Ohio | 3.061.300 | 0,00 | 7.561 | 10,77 | ||||
| 2025-10-22 | 13F | Geneos Wealth Management Inc. | 0 | -100,00 | 0 | |||||
| 2026-02-12 | 13F | Steward Partners Investment Advisory, Llc | 4.584 | 0,00 | 11 | 10,00 | ||||
| 2025-09-25 | NP | VEIEX - Vanguard Emerging Markets Stock Index Fund Investor Shares | 101.325 | -83,73 | 221 | -87,51 | ||||
| 2026-01-27 | 13F | Meritage Portfolio Management | 1.670.089 | -0,29 | 4.125 | 10,44 | ||||
| 2026-02-03 | 13F | Ballentine Partners, LLC | 63.183 | -11,87 | 156 | -1,89 | ||||
| 2025-10-22 | 13F | OneAscent Financial Services LLC | 17.561 | -3,21 | 39 | |||||
| 2026-01-05 | 13F | Park Avenue Securities Llc | 60.977 | 16,71 | 0 | |||||
| 2026-02-10 | 13F | Fielder Capital Group LLC | 88.689 | 0,00 | 219 | 11,17 | ||||
| 2026-01-30 | 13F | Keybank National Association/oh | 91.237 | 0,09 | 225 | 10,84 | ||||
| 2026-02-17 | 13F | Atom Investors LP | 18.458 | -61,58 | 46 | -57,94 | ||||
| 2026-02-06 | 13F | Profund Advisors Llc | 211.571 | 10,55 | 523 | 22,54 | ||||
| 2026-01-29 | 13F | UMA Financial Services, Inc. | 1.030 | 0,00 | 3 | 0,00 | ||||
| 2025-09-26 | NP | SGOVX - First Eagle Overseas Fund Class A | 75.441.038 | 0,00 | 164.461 | -13,83 | ||||
| 2026-02-17 | 13F | Optiver Holding B.V. | Call | 1.962.500 | -5,19 | 4.847 | 5,00 | |||
| 2026-02-17 | 13F | National Asset Management, Inc. | 55.712 | -3,87 | 138 | 6,20 | ||||
| 2026-02-17 | 13F | Optiver Holding B.V. | Put | 2.181.300 | 9,97 | 5.388 | 21,80 | |||
| 2026-02-13 | 13F | Neuberger Berman Group LLC | 228.386 | -6,87 | 564 | 3,30 | ||||
| 2026-02-17 | 13F | Optiver Holding B.V. | 265.188 | -87,97 | 655 | -86,67 | ||||
| 2025-08-28 | NP | SLGAX - SIMT Large Cap Fund Class F | 1.367.493 | 49,72 | 3.296 | 54,84 | ||||
| 2025-08-29 | NP | LIGYX - Loomis Sayles International Growth Fund Class Y | 309.650 | -1,65 | 746 | 1,77 | ||||
| 2026-02-11 | 13F | Brandywine Global Investment Management, LLC | 308.950 | -98,17 | 763 | -97,97 | ||||
| 2026-01-22 | 13F | Bfsg, Llc | 109.130 | 0,00 | 270 | 10,70 | ||||
| 2026-02-09 | 13F | Fisher Asset Management, LLC | 590.438 | -17,22 | 1.458 | -8,30 | ||||
| 2026-02-17 | 13F | Tower Research Capital LLC (TRC) | 69.022 | 343,42 | 170 | 400,00 | ||||
| 2026-02-17 | 13F | Schonfeld Strategic Advisors LLC | 0 | -100,00 | 0 | |||||
| 2025-09-26 | NP | EPDPX - EuroPac International Dividend Income Fund Class A | 700.000 | 0,00 | 1.526 | -13,83 | ||||
| 2026-02-10 | 13F | CIBC World Markets Inc. | 5.982.701 | 3,84 | 14.777 | 15,01 | ||||
| 2026-02-12 | 13F | Callan Family Office, LLC | 688.379 | 427,76 | 1.700 | 486,21 | ||||
| 2025-09-26 | NP | REAYX - Equity Income Fund Class Y | 197.943 | -4,78 | 432 | -17,90 | ||||
| 2026-02-13 | 13F | Kestra Advisory Services, LLC | 0 | -100,00 | 0 | |||||
| 2026-01-26 | 13F | Monument Capital Management | 10.148 | 25 | ||||||
| 2026-02-09 | 13F | North Star Asset Management Inc | 13.215 | 33 | ||||||
| 2026-02-17 | 13F | Advisor Group Holdings, Inc. | 85.401 | 54,86 | 211 | 70,73 | ||||
| 2026-02-11 | 13F | Group One Trading, L.p. | 46.809 | -56,68 | 116 | -52,08 | ||||
| 2026-02-11 | 13F | Group One Trading, L.p. | Put | 150.600 | -12,03 | 372 | -2,62 | |||
| 2025-09-25 | NP | VGTSX - Vanguard Total International Stock Index Fund Investor Shares | 383.229 | 0,00 | 835 | -13,83 | ||||
| 2026-02-13 | 13F | Dynamic Technology Lab Private Ltd | 16.023 | -27,22 | 40 | -18,37 | ||||
| 2026-02-04 | 13F | Abc Arbitrage Sa | 0 | -100,00 | 0 | |||||
| 2025-11-14 | 13F | Cubist Systematic Strategies, LLC | 87.186 | -95,90 | 194 | -96,21 | ||||
| 2026-01-21 | 13F | Leo Wealth, LLC | 33.174 | 82 | ||||||
| 2026-02-12 | 13F | Great Lakes Advisors, Llc | 9.414.370 | 0,72 | 23.253 | 11,56 | ||||
| 2026-01-14 | 13F | Exchange Traded Concepts, Llc | 5.588.912 | 41,47 | 13.805 | 56,69 | ||||
| 2026-02-03 | 13F | Crossmark Global Holdings, Inc. | 114.768 | 0,00 | 283 | 10,98 | ||||
| 2026-02-10 | 13F | Verus Capital Partners, Llc | 144.000 | 71,43 | 356 | 89,84 | ||||
| 2026-02-13 | 13F | Mml Investors Services, Llc | 314.019 | 19,80 | 776 | 32,71 | ||||
| 2025-09-25 | NP | DFCEX - Emerging Markets Core Equity Portfolio - Institutional Class This fund is a listed as child fund of Dimensional Fund Advisors Lp and if that institution has disclosed ownership in this security, then these positions will not be double counted when calculating total shares and total value | 3.022.063 | 0,00 | 6.588 | -13,83 | ||||
| 2026-01-22 | 13F | Mh & Associates Securities Management Corp /adv | 699.168 | 1.727 | ||||||
| 2025-09-25 | NP | DFAE - Dimensional Emerging Core Equity Market ETF | 1.287.467 | 7,14 | 2.807 | -7,70 | ||||
| 2026-01-21 | 13F/A | Euro Pacific Asset Management, LLC | 3.044.462 | -2,68 | 7 | 0,00 | ||||
| 2025-09-26 | NP | UBPIX - Ultralatin America Profund Investor Class | 99.928 | 14,10 | 218 | -1,81 | ||||
| 2025-09-25 | NP | VEU - Vanguard FTSE All-World ex-US Index Fund ETF Shares | 3.139.140 | 0,00 | 6.843 | -13,84 | ||||
| 2026-02-17 | 13F | Guggenheim Capital Llc | 231.449 | 143,43 | 572 | 169,34 | ||||
| 2026-02-12 | 13F | Quadrant Capital Group Llc | 2.243 | -84,71 | 6 | -84,37 | ||||
| 2026-01-22 | 13F | Massachusetts Financial Services Co /ma/ | 34.879.949 | -3,27 | 86.153 | 7,14 | ||||
| 2026-02-13 | 13F | 1832 Asset Management L.P. | 71.951 | 178 | ||||||
| 2025-10-14 | 13F | S.A. Mason LLC | 0 | -100,00 | 0 | |||||
| 2026-02-12 | 13F | Commonwealth Equity Services, Llc | 104.992 | -12,95 | 259 | |||||
| 2025-11-13 | 13F | Rehmann Capital Advisory Group | 15.468 | -33,12 | 34 | -38,18 | ||||
| 2026-01-30 | 13F/A | M&t Bank Corp | 13.000 | -1,77 | 32 | 10,34 | ||||
| 2026-02-17 | 13F | Creative Planning | 540.513 | 158,64 | 1.335 | 186,48 | ||||
| 2025-09-26 | 13F | Capital A Wealth Management, LLC | 0 | -100,00 | 0 | |||||
| 2026-02-13 | 13F | Generation Capital Management LLC | 15.000 | 0,00 | 37 | 12,12 | ||||
| 2026-01-08 | 13F | Grove Bank & Trust | 15.367 | -3,90 | 38 | 5,71 | ||||
| 2026-01-30 | 13F | Wagner Wealth Management, Llc | 10.525 | 0,00 | 26 | 8,70 | ||||
| 2026-02-13 | 13F | Ubs Asset Management Americas Inc | 5.913 | 15 | ||||||
| 2025-11-14 | 13F | Wetherby Asset Management Inc | 43.906 | -24,05 | 98 | -30,22 | ||||
| 2026-02-06 | 13F | Plan A Wealth LLC | 13.833 | -25,23 | 34 | -17,07 | ||||
| 2026-02-17 | 13F | Point72 Asset Management, L.P. | 0 | -100,00 | 0 | |||||
| 2025-11-07 | 13F | CenterBook Partners LP | 0 | -100,00 | 0 | |||||
| 2026-01-29 | 13F | UBS Group AG | 5.758.217 | -3,84 | 14.223 | 6,51 | ||||
| 2026-02-18 | 13F | GWM Advisors LLC | 23.578 | 17,74 | 58 | 31,82 | ||||
| 2026-02-13 | 13F | Toroso Investments, LLC | 277.850 | 6,39 | 686 | 17,87 | ||||
| 2026-02-06 | 13F | Pzena Investment Management Llc | 4.421.619 | -2,06 | 10.921 | 8,48 | ||||
| 2026-02-09 | 13F | Endowment Wealth Management, Inc. | 15.740 | 0,98 | 39 | 11,76 | ||||
| 2026-01-28 | 13F | Kapitalo Investimentos Ltda | 647.014 | -63,74 | 1.598 | -59,83 | ||||
| 2026-02-10 | 13F | Bank of New York Mellon Corp | 732.114 | -21,62 | 1.808 | -13,16 | ||||
| 2026-02-06 | 13F | Cullen/frost Bankers, Inc. | 32.075 | 0,00 | 79 | 11,27 | ||||
| 2026-01-13 | 13F | Mather Group, Llc. | 0 | -100,00 | 0 | |||||
| 2026-01-27 | 13F | Evergreen Capital Management Llc | 17.516 | 15,72 | 45 | 29,41 | ||||
| 2026-02-13 | 13F | MAI Capital Management | 0 | -100,00 | 0 | |||||
| 2026-02-13 | 13F | OpenArc Corporate Advisory, LLC | 42.010 | 104 | ||||||
| 2026-01-09 | 13F | SG Americas Securities, LLC | 0 | -100,00 | 0 | |||||
| 2026-02-17 | 13F | Amundi | 493.534 | 2.742,28 | 1.219 | 3.194,59 | ||||
| 2026-01-21 | 13F | Yousif Capital Management, Llc | 59.597 | 0,00 | 155 | 16,67 | ||||
| 2025-11-14 | 13F | Jane Street Group, Llc | Put | 0 | -100,00 | 0 | -100,00 | |||
| 2026-02-02 | 13F | Benjamin Edwards Inc | 100.382 | 35,15 | 248 | 49,70 | ||||
| 2026-02-09 | 13F | Legal & General Group Plc | 2.709.873 | 0,00 | 6.680 | 10,78 | ||||
| 2025-09-25 | NP | DEXC - Dimensional Emerging Markets ex China Core Equity ETF | 31.100 | 29,58 | 68 | 11,67 | ||||
| 2026-02-03 | 13F | Privium Fund Management B.V. | 1.063.174 | 18,51 | 2.626 | 31,30 | ||||
| 2026-01-22 | 13F | Bear Mountain Capital, Inc. | 32 | 3,23 | 0 | |||||
| 2026-02-12 | 13F | Bank Of Montreal /can/ | 749.625 | 19,19 | 1.852 | 32,03 | ||||
| 2026-01-26 | 13F | Merit Financial Group, LLC | 23.932 | -66,17 | 59 | -62,42 | ||||
| 2025-10-21 | 13F | Jarislowsky, Fraser Ltd | 71.951 | 1,05 | 160 | -6,43 | ||||
| 2025-09-26 | NP | EPIVX - EuroPac International Value Fund Class A | 750.656 | 0,00 | 1.636 | -13,85 | ||||
| 2026-02-11 | 13F | Franklin Resources Inc | 919.157 | 7,09 | 2.270 | 18,60 | ||||
| 2026-02-06 | 13F | Csenge Advisory Group | 125.924 | 311 | ||||||
| 2025-10-28 | 13F | Country Trust Bank | 0 | -100,00 | 0 | |||||
| 2025-09-25 | NP | DFEM - Dimensional Emerging Markets Core Equity 2 ETF | 843.544 | 52,01 | 1.839 | 30,91 | ||||
| 2025-11-03 | 13F | LRI Investments, LLC | 0 | -100,00 | 0 | |||||
| 2025-09-26 | NP | FSGEX - Fidelity Series Global ex U.S. Index Fund This fund is a listed as child fund of Fmr Llc and if that institution has disclosed ownership in this security, then these positions will not be double counted when calculating total shares and total value | 42.444 | -70,74 | 93 | -74,93 | ||||
| 2026-02-06 | 13F | HighTower Advisors, LLC | 43.371 | 3,37 | 107 | 15,05 | ||||
| 2026-02-12 | 13F | Brinker Capital Investments, LLC | 25.485 | 63 | ||||||
| 2026-02-17 | 13F | NorthRock Partners, LLC | 15.833 | 4,94 | 39 | 18,18 | ||||
| 2025-10-21 | 13F | GAM Holding AG | 0 | -100,00 | 0 | |||||
| 2025-11-14 | 13F | Aigen Investment Management, Lp | 0 | -100,00 | 0 | |||||
| 2025-11-12 | 13F | Foresight Global Investors, Inc. | 0 | -100,00 | 0 | |||||
| 2026-02-05 | 13F | Cornerstone Wealth Management, LLC | 12.900 | 0,00 | 32 | 10,71 | ||||
| 2026-02-09 | 13F | Harbour Investments, Inc. | 247 | 0,00 | 1 | |||||
| 2026-01-15 | 13F | Hara Capital LLC | 4.100 | -77,70 | 10 | -75,61 | ||||
| 2025-11-14 | 13F | Silvercrest Asset Management Group Llc | 0 | -100,00 | 0 | |||||
| 2026-02-13 | 13F | Sei Investments Co | 1.856.872 | -21,43 | 4.587 | -12,98 | ||||
| 2026-02-17 | 13F | Modern Wealth Management, LLC | 0 | -100,00 | 0 | |||||
| 2026-01-30 | 13F | Turning Point Benefit Group, Inc. | 115 | 0,00 | 0 | |||||
| 2026-02-17 | 13F | Henry James International Management Inc. | 14.715 | -3,02 | 36 | 9,09 | ||||
| 2025-11-05 | 13F | SOUTH STATE Corp | 0 | -100,00 | 0 | |||||
| 2026-01-09 | 13F | Seafarer Capital Partners, LLC | 28.069.000 | 0,00 | 69.330 | 10,76 | ||||
| 2025-11-13 | 13F | Banque Cantonale Vaudoise | 0 | -100,00 | 0 | |||||
| 2026-02-17 | 13F | Mercer Global Advisors Inc /adv | 44.408 | -14,23 | 110 | -5,22 | ||||
| 2026-02-10 | 13F | Bnp Paribas Arbitrage, Sa | 248.860 | -25,83 | 615 | -17,91 | ||||
| 2026-01-21 | 13F | Unison Advisors LLC | 311.038 | 1,06 | 809 | 16,74 | ||||
| 2026-01-12 | 13F | Foster Group, Inc. | 12.166 | 30 | ||||||
| 2026-01-12 | 13F | VisionPoint Advisory Group, LLC | 14.454 | 36 | ||||||
| 2025-08-28 | NP | CWI - SPDR(R) MSCI ACWI EX-US ETF | 427.751 | 0,35 | 1.031 | 3,73 | ||||
| 2026-02-10 | 13F | Eurizon Capital SGR S.p.A. | 3.321 | 8 | ||||||
| 2025-12-18 | 13F/A | Westwood Global Investments, LLC | 101.488.754 | -3,18 | 226.320 | -10,42 | ||||
| 2026-02-02 | 13F | Qrg Capital Management, Inc. | 137.034 | 31,49 | 338 | 45,69 | ||||
| 2026-02-12 | 13F | Federation des caisses Desjardins du Quebec | 100.451 | 4,40 | 248 | 15,89 | ||||
| 2026-02-09 | 13F | Geode Capital Management, Llc | 58.937 | 0,00 | 146 | 10,69 | ||||
| 2026-02-23 | 13F | Vinland Capital Management Gestora de Recursos LTDA. | 0 | -100,00 | 0 | -100,00 | ||||
| 2026-02-17 | 13F | Parvin Asset Management, LLC | 271.500 | -21,30 | 671 | -12,87 | ||||
| 2026-02-17 | 13F | Cetera Investment Advisers | 893.072 | -0,72 | 2.206 | 9,92 | ||||
| 2026-01-05 | 13F | Park National Corp /oh/ | 16.386 | 40 | ||||||
| 2026-01-21 | 13F | Prime Capital Investment Advisors, LLC | 10.657 | 5,56 | 26 | 18,18 | ||||
| 2026-02-10 | 13F | Envestnet Asset Management Inc | 3.578.873 | 5,60 | 8.840 | 16,96 | ||||
| 2025-09-25 | NP | DFA INVESTMENT DIMENSIONS GROUP INC - World ex U.S. Core Equity Portfolio Institutional Class Shares | 117.295 | -4,72 | 256 | -18,01 | ||||
| 2026-01-29 | 13F | Ashton Thomas Private Wealth, LLC | 2.674.833 | 0,58 | 6.829 | 14,10 | ||||
| 2026-02-05 | 13F | Allworth Financial LP | 28.275 | 10,11 | 70 | 21,05 | ||||
| 2026-02-11 | 13F | IMA Wealth, Inc. | 451 | 1 | ||||||
| 2026-01-20 | 13F | Aspiriant, Llc | 25.148 | 0,59 | 62 | 12,73 | ||||
| 2026-02-13 | 13F | Dodge & Cox | 296.300 | 7,24 | 732 | 18,67 | ||||
| 2026-02-19 | 13F | Invesco Ltd. | 3.507.781 | -9,63 | 8.664 | 0,09 | ||||
| 2026-02-02 | 13F | Altrius Capital Management Inc | 4.024.373 | -0,22 | 9.940 | 10,52 | ||||
| 2026-02-13 | 13F | Integrated Wealth Concepts LLC | 16.214 | 18,26 | 40 | 33,33 | ||||
| 2026-02-11 | 13F | Vise Technologies, Inc. | 25.831 | 64 | ||||||
| 2026-01-08 | 13F | Genesis Private Wealth, Llc | 0 | -100,00 | 0 | |||||
| 2026-01-08 | 13F | Traveka Wealth, LLC | 13.880 | -3,49 | 34 | 6,25 | ||||
| 2026-01-16 | 13F | Ronald Blue Trust, Inc. | 185.808 | -5,65 | 459 | 4,33 | ||||
| 2026-02-17 | 13F | Stansberry Asset Management, Llc | 0 | -100,00 | 0 | |||||
| 2026-01-29 | 13F | St Germain D J Co Inc | 2.339 | 6 | ||||||
| 2026-02-17 | 13F | CHICAGO TRUST Co NA | 0 | -100,00 | 0 | |||||
| 2026-01-14 | 13F | Jfs Wealth Advisors, Llc | 549 | 94,68 | 1 | |||||
| 2026-02-11 | 13F | Metis Global Partners, LLC | 24.712 | -7,51 | 61 | 3,39 | ||||
| 2026-02-11 | 13F | Jpmorgan Chase & Co | 258.301 | -13,08 | 638 | -3,63 | ||||
| 2026-02-13 | 13F | SRS Capital Advisors, Inc. | 6.733 | 13,91 | 17 | 23,08 | ||||
| 2026-02-12 | 13F | Marex Group plc | 35.535 | 80,02 | 88 | 97,73 | ||||
| 2026-01-21 | 13F | Hartford Financial Management Inc. | 56.791 | 312,76 | 140 | 366,67 | ||||
| 2026-01-20 | 13F | Red Door Wealth Management, LLC | 19.000 | 0,00 | 47 | 9,52 | ||||
| 2025-08-28 | NP | SIEMX - SIT EMERGING MARKETS EQUITY FUND - CLASS F, effective 1-31-2017 (formerly Class A) | 413.410 | -62,13 | 996 | -60,83 | ||||
| 2026-01-16 | 13F | Perigon Wealth Management, LLC | 15.411 | 34,30 | 38 | 52,00 | ||||
| 2026-01-27 | 13F | First Horizon Corp | 73.935 | 102,18 | 183 | 124,69 | ||||
| 2026-01-14 | 13F | Generali Investments CEE, investicni spolecnost, a.s. | 120.818 | -45,52 | 298 | -39,68 | ||||
| 2026-02-11 | 13F | Empowered Funds, LLC | 122.848 | 14,93 | 303 | 27,31 | ||||
| 2026-01-16 | 13F | Eldred Rock Partners, LLC | 3.560.200 | -10,14 | 8.794 | -1,49 | ||||
| 2026-01-15 | 13F | Allspring Global Investments Holdings, LLC | 13.320.745 | -0,32 | 32.902 | 11,40 | ||||
| 2026-02-10 | 13F | Goldman Sachs Group Inc | 13.135.697 | 248,07 | 32.445 | 285,56 | ||||
| 2026-02-20 | 13F | Sunbelt Securities, Inc. | 0 | -100,00 | 0 | |||||
| 2026-01-22 | 13F | Foundation Resource Management Inc | 6.939.320 | 0,81 | 17.140 | 11,66 | ||||
| 2026-02-17 | 13F | Wiley Bros.-aintree Capital, Llc | 27.390 | 38,33 | 68 | 52,27 | ||||
| 2026-01-13 | 13F | Wynn Capital, LLC | 130.640 | 2,35 | 323 | 13,38 | ||||
| 2026-02-13 | 13F | Barclays Plc | 0 | -100,00 | 0 | |||||
| 2025-11-14 | 13F | Wolverine Trading, Llc | Call | 13.600 | -23,60 | 31 | -26,19 | |||
| 2025-09-26 | NP | UUPIX - Ultraemerging Markets Profund Investor Class | 21.520 | 22,85 | 47 | 4,55 | ||||
| 2026-02-12 | 13F | Skopos Labs, Inc. | 77.261 | 174,89 | 187 | 181,82 | ||||
| 2025-11-07 | 13F | Fifth Third Bancorp | 0 | -100,00 | 0 | |||||
| 2026-01-21 | 13F | Sound Income Strategies, LLC | 1.000 | 3 | ||||||
| 2026-01-08 | 13F | Wealth Enhancement Advisory Services, Llc | 90.045 | -10,15 | 226 | 4,63 | ||||
| 2026-02-17 | 13F | Two Sigma Investments, Lp | 2.004.169 | -31,84 | 4.950 | -24,51 | ||||
| 2025-10-31 | 13F | Whittier Trust Co Of Nevada Inc | 0 | -100,00 | 0 | |||||
| 2025-11-03 | 13F | New York State Common Retirement Fund | 0 | -100,00 | 0 | |||||
| 2025-11-14 | 13F | Engineers Gate Manager LP | 0 | -100,00 | 0 | |||||
| 2026-02-10 | 13F | Savant Capital, LLC | 15.102 | 37 | ||||||
| 2025-09-26 | NP | DIVD - Altrius Global Dividend ETF | 94.502 | 7,69 | 206 | -7,21 | ||||
| 2026-02-12 | 13F | Brown Brothers Harriman & Co | 1.935 | -91,87 | 5 | -93,22 | ||||
| 2026-01-15 | 13F | Archford Capital Strategies, LLC | 943.053 | 1,06 | 2.329 | 11,97 | ||||
| 2025-10-30 | 13F | Twin Peaks Wealth Advisors, LLC | 0 | -100,00 | 0 | |||||
| 2026-02-11 | 13F | Allianz Asset Management GmbH | 150.000 | 0,00 | 370 | 10,78 | ||||
| 2026-01-23 | 13F | U.S. Capital Wealth Advisors, LLC | 0 | -100,00 | 0 | |||||
| 2026-01-26 | 13F | Mirae Asset Global Investments Co., Ltd. | 240.887 | 1,99 | 595 | 12,93 | ||||
| 2026-02-17 | 13F | XTX Topco Ltd | 545.949 | 353,49 | 1.348 | 402,99 | ||||
| 2026-02-18 | 13F | Vident Advisory, LLC | 240.982 | 51,49 | 595 | 68,08 | ||||
| 2026-02-10 | 13F | Moors & Cabot, Inc. | 105.400 | 2,43 | 260 | 13,54 | ||||
| 2026-02-12 | 13F | Dimensional Fund Advisors Lp | 10.318.325 | 8,37 | 25.489 | 19,95 | ||||
| 2026-02-13 | 13F | Arkadios Wealth Advisors | 44.391 | -41,98 | 110 | -35,88 | ||||
| 2025-10-31 | 13F | Mitsubishi UFJ Trust & Banking Corp | 0 | -100,00 | 0 | -100,00 | ||||
| 2026-01-14 | 13F | Spire Wealth Management | 14.771 | -64,81 | 36 | -61,29 | ||||
| 2026-02-09 | 13F | Morningstar Investment Management LLC | 1.572.660 | -22,92 | 4 | -25,00 | ||||
| 2026-02-14 | 13F | Rockefeller Capital Management L.P. | 5.125 | 20,45 | 13 | 33,33 | ||||
| 2025-11-13 | 13F | Grantham, Mayo, Van Otterloo & Co. LLC | 0 | -100,00 | 0 | |||||
| 2026-02-05 | 13F | Bessemer Group Inc | 23.197 | 11,97 | 0 | |||||
| 2026-02-09 | 13F | Texas Capital Bank Wealth Management Services Inc | 15.555 | 38 | ||||||
| 2026-02-12 | 13F | EntryPoint Capital, LLC | 80.986 | 200 | ||||||
| 2025-08-28 | NP | QEMM - SPDR MSCI Emerging Markets StrategicFactors ETF | 3.414 | -3,97 | 8 | 0,00 | ||||
| 2026-01-28 | 13F | Old National Bancorp /in/ | 42.372 | 82,63 | 105 | 103,92 | ||||
| 2026-02-04 | 13F | Western Pacific Wealth Management, LP | 1.000 | 0,00 | 2 | 0,00 | ||||
| 2026-02-19 | 13F | TMB Capital Partners, LLC | 29.701 | 73 | ||||||
| 2026-02-13 | 13F | GQG Partners LLC | 172.969.655 | 9,13 | 427.235 | 20,87 | ||||
| 2025-09-23 | NP | GERIX - Goldman Sachs Emerging Markets Equity Insights Fund Institutional | 0 | -100,00 | 0 | -100,00 | ||||
| 2026-01-26 | 13F | Cwm, Llc | 8.473 | 51,82 | 0 | |||||
| 2026-02-12 | 13F | Mount Yale Investment Advisors, LLC | 15.263 | 4,18 | 39 | 15,15 | ||||
| 2026-02-06 | 13F | Mraz, Amerine & Associates, Inc. | 706.674 | -0,68 | 1.745 | 10,03 | ||||
| 2026-02-13 | 13F | Parkside Financial Bank & Trust | 20.239 | 1.459,24 | 50 | 2.350,00 | ||||
| 2026-01-06 | 13F | Chemistry Wealth Management LLC | 35.000 | 0,00 | 86 | 10,26 | ||||
| 2026-01-23 | 13F | Transcend Wealth Collective, Llc | 92.992 | 47,54 | 230 | 63,57 | ||||
| 2026-02-10 | 13F | IFG Advisory, LLC | 26.075 | 64 | ||||||
| 2026-01-09 | 13F | Oldfield Partners LLP | 383.700 | -54,96 | 948 | -50,13 | ||||
| 2025-08-28 | NP | SPGM - SPDR(R) Portfolio MSCI Global Stock Market ETF | 85.485 | 2,96 | 206 | 6,74 | ||||
| 2026-02-05 | 13F | Commerzbank Aktiengesellschaft /fi | 73.961 | 0,00 | 0 | |||||
| 2026-02-12 | 13F | Loomis Sayles & Co L P | 19.300.817 | -0,88 | 47.673 | 9,79 | ||||
| 2026-02-13 | 13F | Wealth Alliance | 23.950 | -5,62 | 59 | 5,36 | ||||
| 2026-02-10 | 13F | Quantbot Technologies LP | 0 | -100,00 | 0 | |||||
| 2026-01-26 | 13F | Moran Wealth Management, LLC | 2.258.941 | 15,03 | 5.580 | 27,40 | ||||
| 2026-01-20 | 13F | Stratos Wealth Partners, LTD. | 41.725 | 103 | ||||||
| 2026-01-23 | 13F | Sage Investment Counsel LLC | 165.500 | 0,00 | 409 | 10,57 | ||||
| 2026-02-17 | 13F | Millennium Management Llc | 2.309.557 | 4.175,37 | 5.705 | 4.653,33 | ||||
| 2026-02-17 | 13F | Capstone Financial Advisors, Inc. | 50.000 | 0,00 | 124 | 10,81 | ||||
| 2025-11-07 | 13F | Sierra Ocean, Llc | 0 | -100,00 | 0 | |||||
| 2025-11-04 | 13F | High Note Wealth, LLC | 0 | -100,00 | 0 | |||||
| 2026-01-26 | 13F | Welch Group, LLC | 45.491 | 2,94 | 112 | 14,29 | ||||
| 2026-02-13 | 13F | SPX Equities Gestao de Recursos Ltda | 70.408 | -97,83 | 174 | -97,61 | ||||
| 2026-02-13 | 13F | Headlands Technologies LLC | 0 | -100,00 | 0 | |||||
| 2026-02-09 | 13F | Genus Capital Management Inc. | 71.608 | 0,00 | 177 | 10,69 | ||||
| 2026-02-13 | 13F | Morgan Stanley | 45.462.628 | 291,24 | 112.293 | 333,36 | ||||
| 2026-02-17 | 13F | Quantinno Capital Management LP | 10.108 | 25 | ||||||
| 2026-01-20 | 13F | Toth Financial Advisory Corp | 550 | 1 | ||||||
| 2026-01-13 | 13F | Bank & Trust Co | 0 | -100,00 | 0 | |||||
| 2026-01-27 | 13F | Tranquilli Financial Advisor LLC | 34.929 | 10,59 | 86 | 22,86 | ||||
| 2026-02-13 | 13F | Banco Santander, S.A. | 0 | -100,00 | 0 | |||||
| 2025-09-24 | NP | EQNAX - MFS Equity Income Fund A | 1.971.310 | 4.297 | ||||||
| 2026-02-02 | 13F | Oppenheimer & Co Inc | 20.147 | -1,66 | 50 | 8,89 | ||||
| 2026-02-12 | 13F | Jane Street Group, Llc | Call | 363.600 | 757,55 | 898 | 855,32 | |||
| 2026-02-12 | 13F | Jane Street Group, Llc | 913.795 | -30,89 | 2.257 | -23,44 | ||||
| 2026-02-13 | 13F | Quinn Opportunity Partners LLC | 80.000 | 0,00 | 198 | 10,67 | ||||
| 2026-01-30 | 13F | Bogart Wealth, LLC | 2.555 | 0,00 | 6 | 20,00 | ||||
| 2026-02-17 | 13F | TCG Advisory Services, LLC | 30.927 | -16,31 | 76 | -7,32 | ||||
| 2026-02-11 | 13F | RWC Asset Management LLP | 10.715.881 | -2,30 | 26.468 | 8,21 | ||||
| 2026-02-23 | 13F | Virtu Financial LLC | 702.098 | 234,80 | 2 | |||||
| 2026-02-09 | 13F | Bleakley Financial Group, LLC | 200.026 | 44,77 | 494 | 60,39 | ||||
| 2026-02-17 | 13F | Susquehanna International Group, Llp | Call | 13.513.600 | 3.329,85 | 33.379 | 3.701,59 | |||
| 2025-08-28 | NP | SPEM - SPDR(R) Portfolio Emerging Markets ETF | 6.405.285 | 8,75 | 15.437 | 12,49 | ||||
| 2026-02-13 | 13F | Smartleaf Asset Management LLC | 565 | 0,00 | 1 | 0,00 | ||||
| 2026-02-17 | 13F | Susquehanna International Group, Llp | 932.681 | -0,56 | 2.304 | 10,14 | ||||
| 2026-01-15 | 13F | Nisa Investment Advisors, Llc | 415 | 1 | ||||||
| 2026-02-17 | 13F | Susquehanna International Group, Llp | Put | 12.966.400 | 2.515,78 | 32.027 | 2.798,37 | |||
| 2026-02-06 | 13F | Global Retirement Partners, LLC | 94.624 | 9.695,45 | 234 | 11.550,00 | ||||
| 2025-11-13 | 13F | Jefferies Financial Group Inc. | 0 | -100,00 | 0 | |||||
| 2026-02-11 | 13F | Hilton Head Capital Partners, LLC | 7.685 | 19 | ||||||
| 2026-02-02 | 13F/A | Fortress Wealth Group, LLC | 199.003 | 553 | ||||||
| 2026-02-17 | 13F | Captrust Financial Advisors | 587.468 | -0,81 | 1.451 | 9,92 | ||||
| 2026-01-26 | 13F | PDS Planning, Inc | 14.989 | -2,83 | 37 | 8,82 | ||||
| 2026-02-13 | 13F | Arrowstreet Capital, Limited Partnership | 10.906.088 | -20,13 | 26.938 | -11,54 | ||||
| 2026-02-02 | 13F | Truist Financial Corp | 52.641 | 19,92 | 130 | 34,02 | ||||
| 2026-02-05 | 13F | Mesirow Financial Investment Management, Inc. | 0 | -100,00 | 0 | |||||
| 2026-02-05 | 13F | Abacus Wealth Partners, LLC | 13.495 | 33 | ||||||
| 2026-02-12 | 13F | Circle Wealth Management, LLC | 19.721 | 49 | ||||||
| 2025-08-28 | NP | SEUIX - Simt Large Cap Value Fund Class I | 1.387.221 | -13,03 | 3.343 | -10,04 | ||||
| 2026-02-06 | 13F | IFP Advisors, Inc | 117.428 | -0,32 | 290 | 10,69 | ||||
| 2025-10-31 | 13F | NWF Advisory Services Inc. | 17.902 | 0,00 | 40 | -9,30 | ||||
| 2026-02-17 | 13F | Balyasny Asset Management Llc | 32.513 | 17,62 | 80 | 31,15 | ||||
| 2025-09-26 | NP | RSEAX - U.S. Strategic Equity Fund Class A | 1.571.671 | 0,00 | 3.426 | -13,83 | ||||
| 2026-02-12 | 13F | CIBC Private Wealth Group, LLC | 7.250 | 0,00 | 18 | 6,25 | ||||
| 2026-01-12 | 13F | Moody National Bank Trust Division | 0 | -100,00 | 0 |